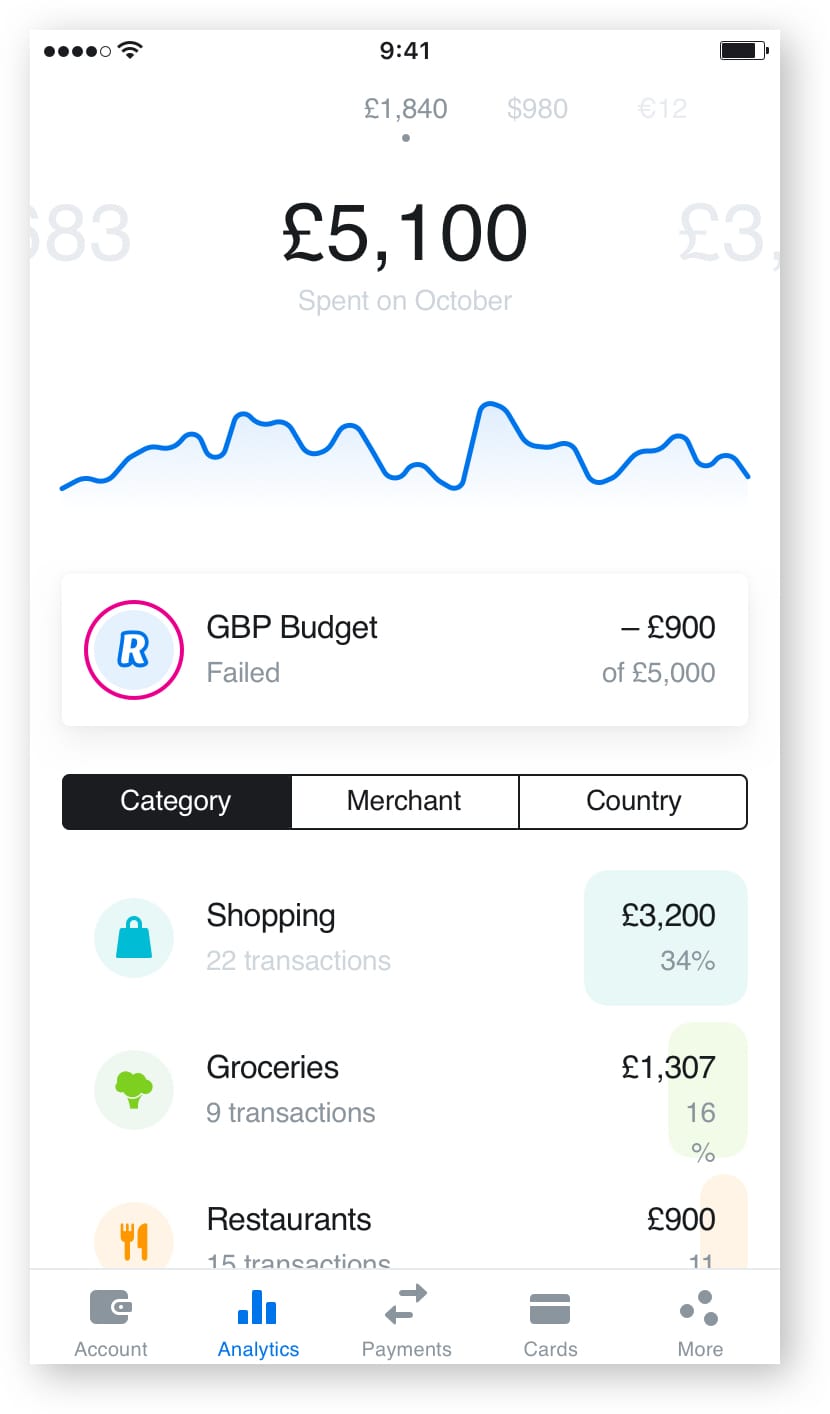
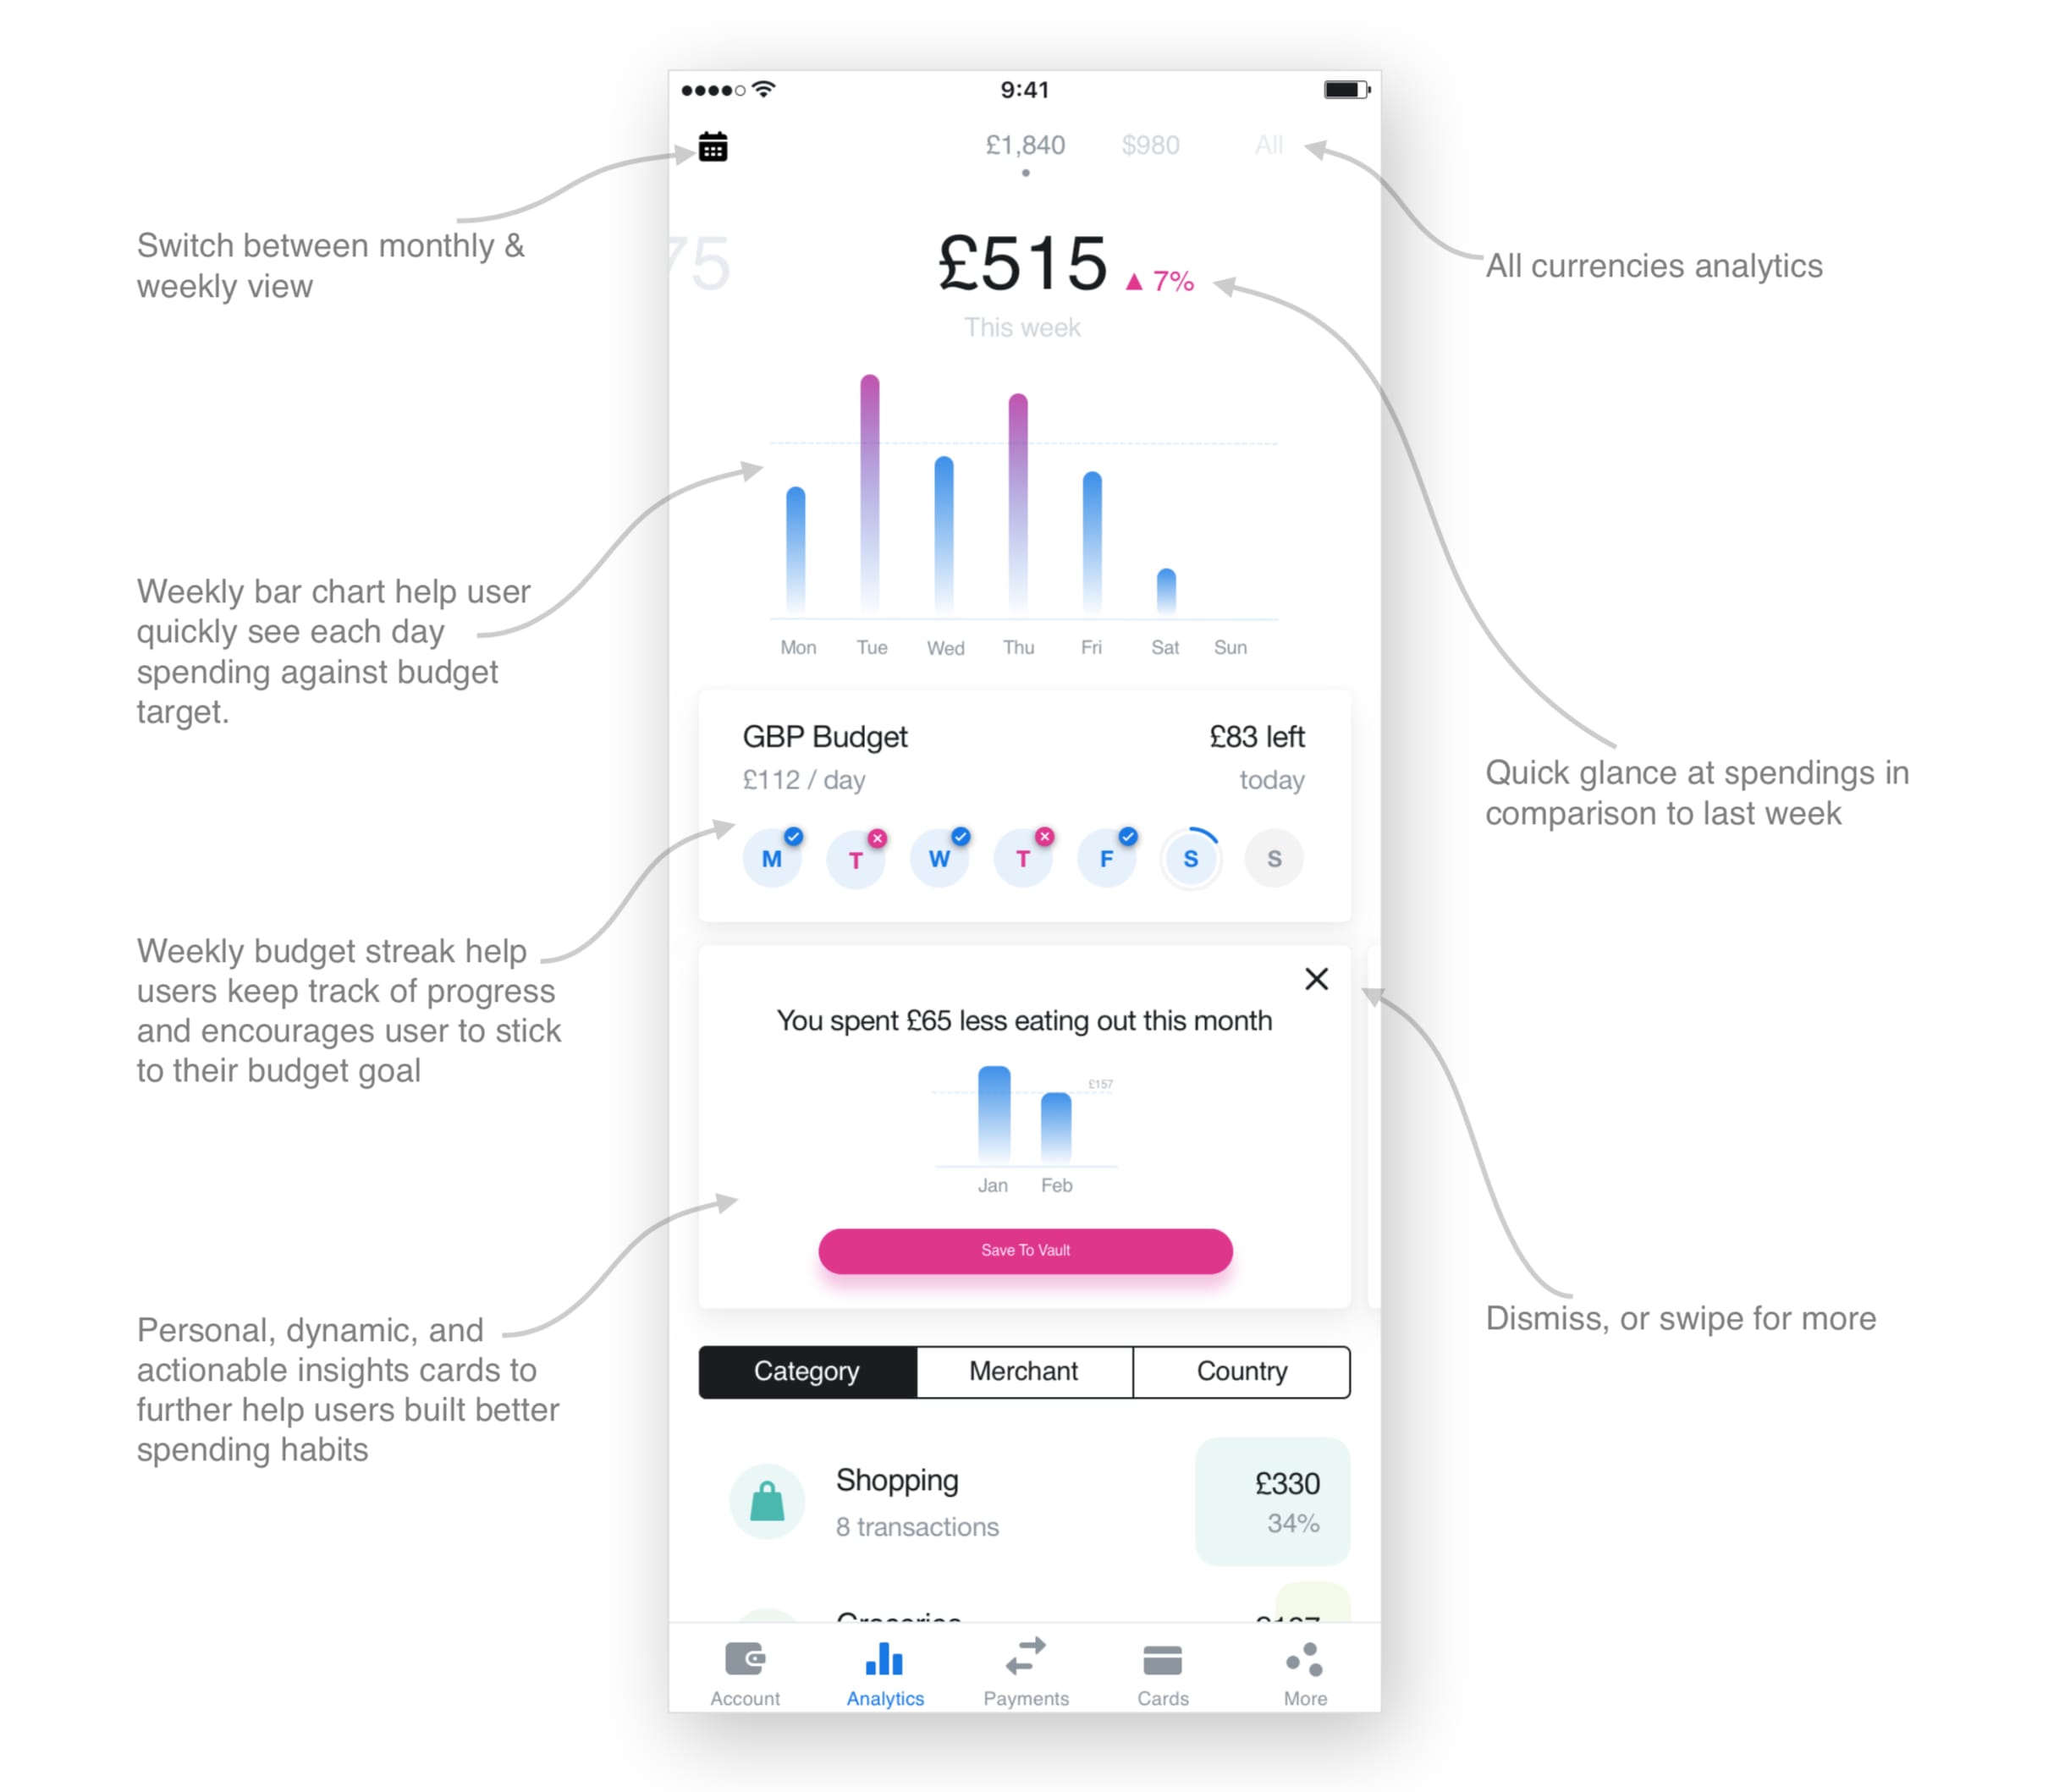
Banking applications used to be clunky, frustrating to use and barely managed the basic function of showing your balance and transactions. Thankfully, those days are long gone, and leading the charge toward better mobile banking experiences are the rising in popularity, mobile only, digital banks. This modern take on retail banking forgone the traditional high street branches and offer their products and customer service solely through an app on customers devices. Therefore, it is critical to their success that these applications provide users with the best possible user experience through helpful functionalities and easy to use interfaces. These challenger banks saw huge success in recent years, and increasingly the innovative solutions they developed are being adopted by more established traditional banks in a bid to stay relevant and competitive.
One key area of innovation that greatly contribute to attracting customers to these challenger banks are the superior spending analytics and budgeting functionalities. Innovations such as automatic spending categorisation and end of the month balance predictions provide users with a much more detailed picture of their spending habits. The goal of this design challenge is to look at how can we further improve these helpful facilities to help users build better financial and spending habits. We will focus this case study on Revolut, currently one of the leading competing digital banks with a large number of active monthly users.
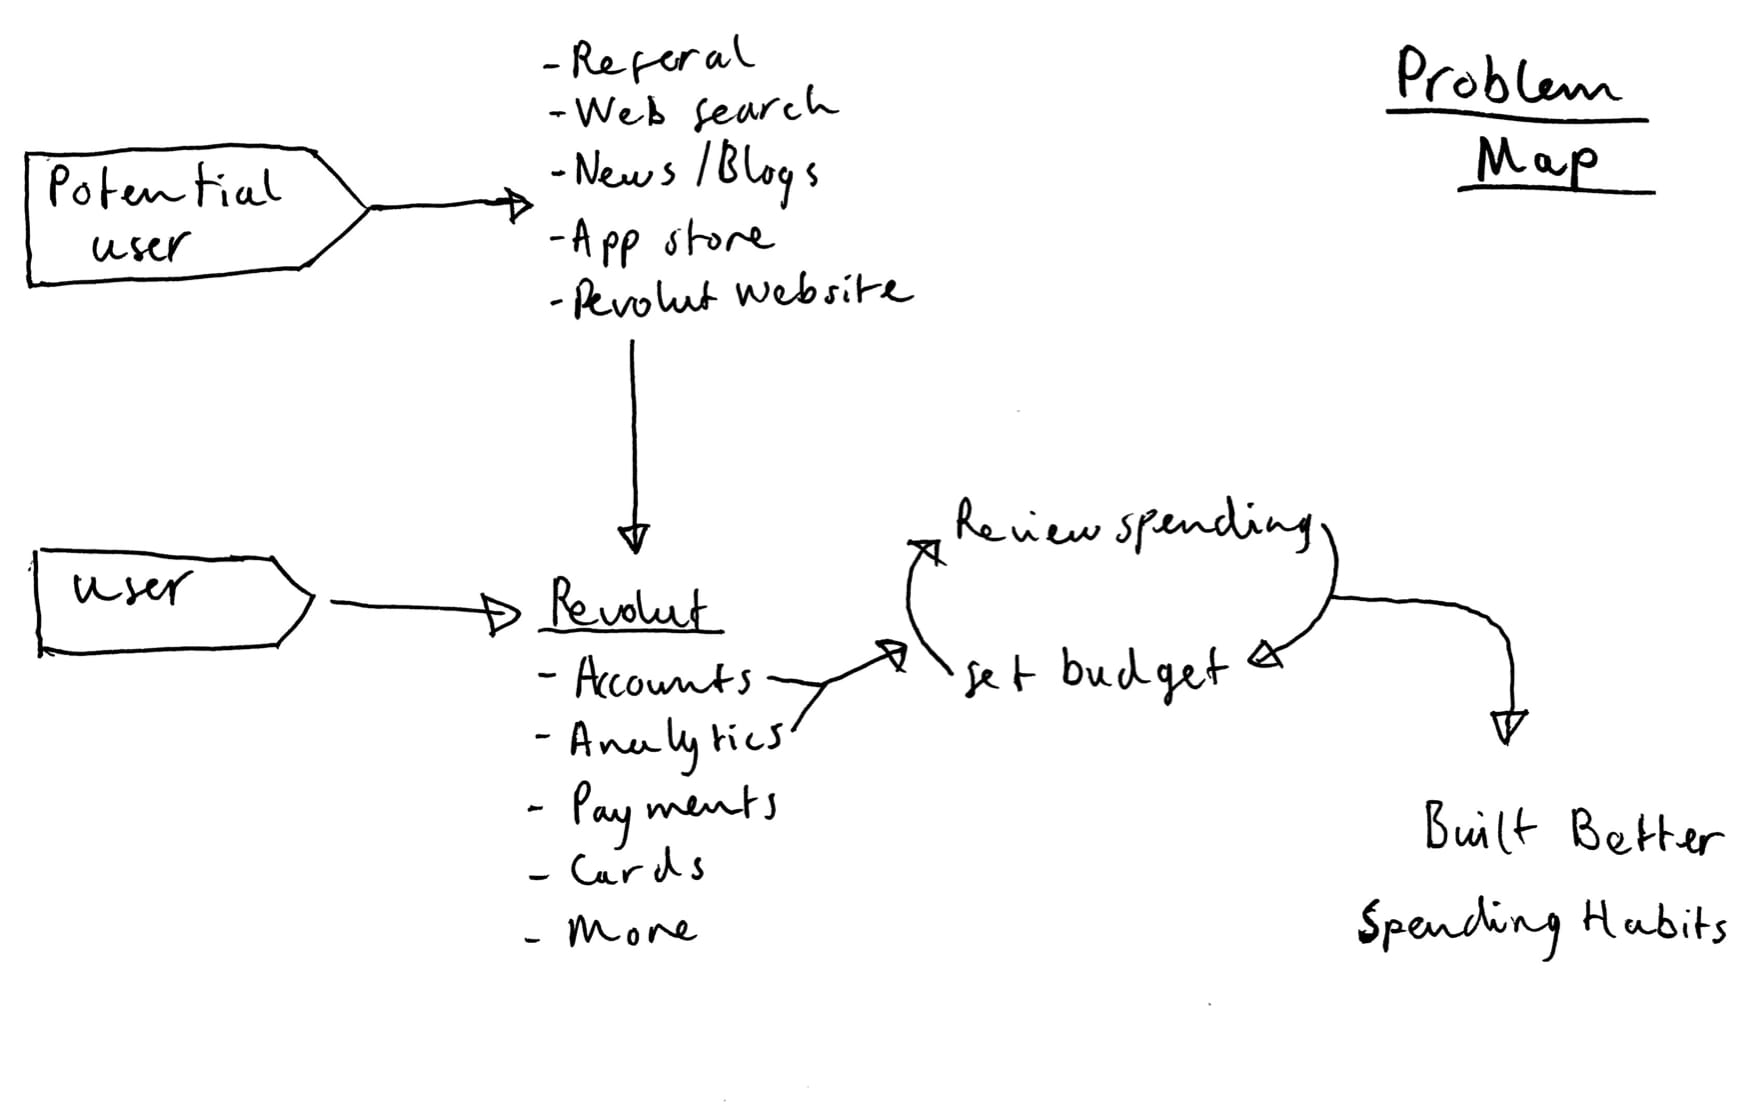
To understand and define the problem, I start exploring by asking relevant questions and devised a simple map to visualise the problem space
I crawl through articles, forums and customers reviews of Revolut and competing products to better understand how user budget and the problem they currently face
How Might We questions were generated from research insights to help focus and guide design directions
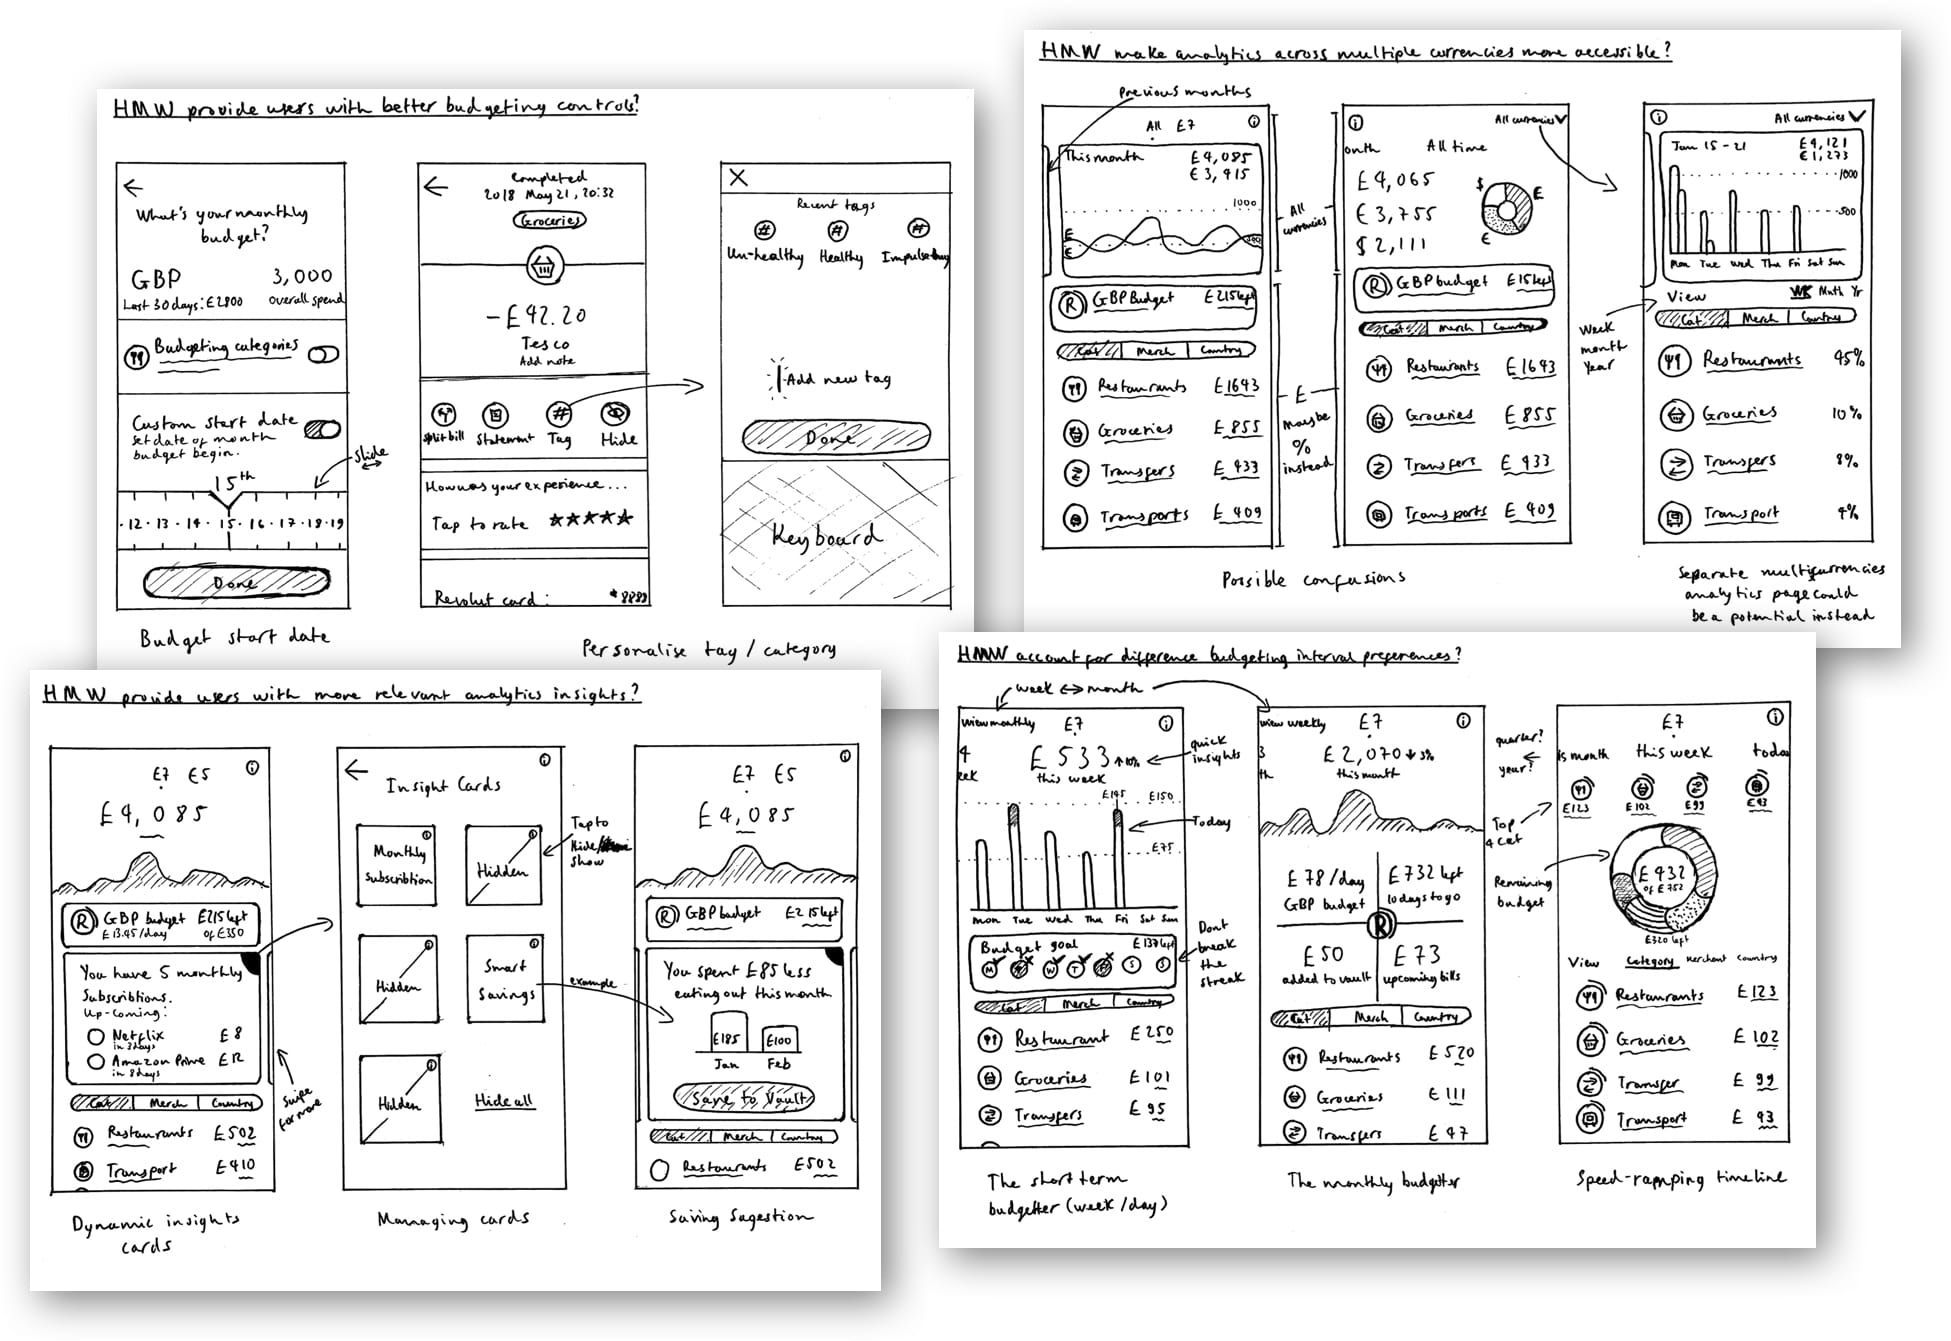
Wireframes and sketches of potential solutions were explored at this stage, focusing on answering the previously generated HMW questions
Synthesising the best ideas from the exploration stages, a high fidelity mockup of the interface were generated using Sketch
What could be the goals of Revolut?
To build a fair and frictionless platform to use and manage money around the world
To build a better global financial network
To make financial services more accessible and easy to use
What are the goals of this project?
To provide users with better analytics and budgeting tools
To help users build better spending habits
Who're the competitors?
Challenger banks
Traditional banks
Other personal finance and budgeting apps
Who’s the target audience?
Revolut users
Potential users
Anyone who wishes to build better spending habits
I conducted a desk research of articles, forums and customers reviews of Revolut and their competitors to better understand the user and the problem they currently face.
This desk research activity focuses on answering:
How do user budget?
What budgeting problems do users face?
What spending habits information users found helpful?
What are the current weak points of Revolut analytics and budgeting?
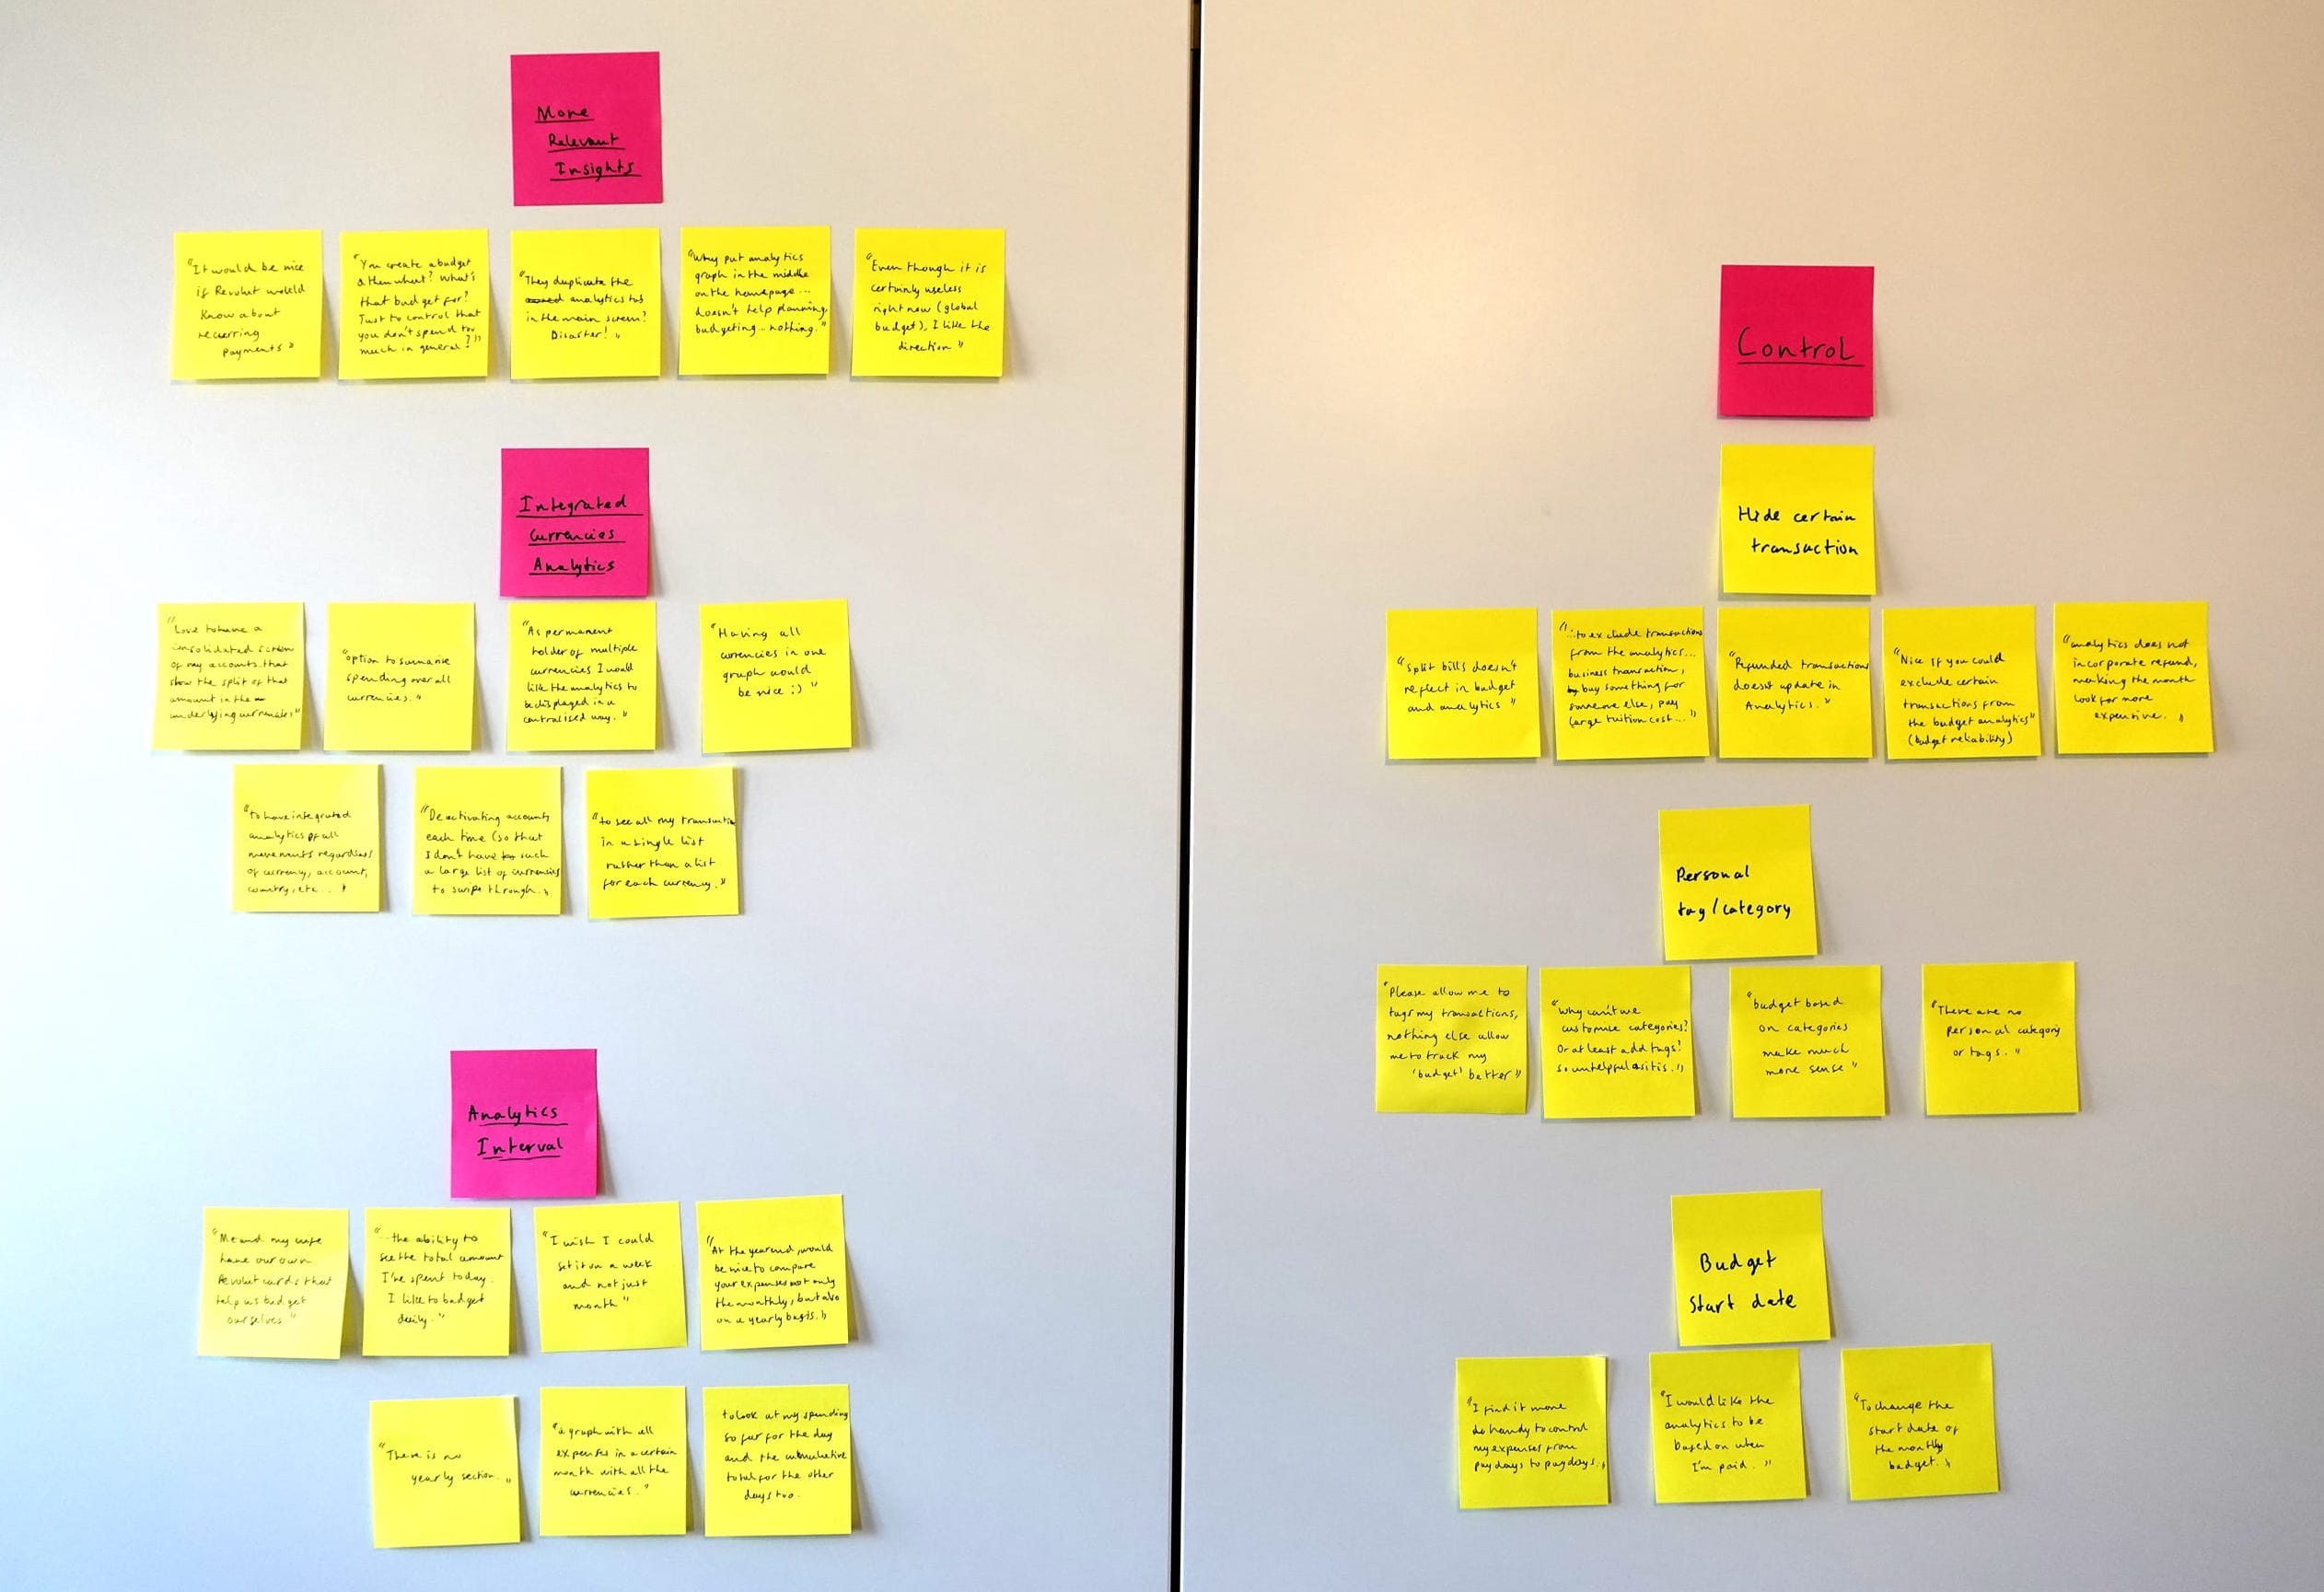
Feedbacks from Revolut users were analysed to build an Affinity Map of the problem space.
This analysis highlighted 4 distinct themes:
Better Controls
Relevant Insights
Multi-Currencies Analytics
Analytics & Budgeting Intervals
Better Controls
Specific transactions - the ability to hide or exclude a specific transaction from analytics is important to help users budget more accurately. “buy something for someone else, pay large tuition cost...”
Personalise tag/category - this could made budgeting more personal and useful to some users.
Budget start date - a number of users found budgeting from payday to payday more helpful.
Relevant Insights
Some users found static spending data graphs and global budgeting target not helpful enough. Suggesting a potential to explore more dynamic and active insights such as recognising and account for recurring payments in monthly budgets.
Multi-Currencies Analytics
Many users disliked the fragmentation nature of how analytics currently handled multi-currencies. Multi-currencies holder found the limitation to view analytics one currency at a time inconvenience, prevented them from understanding the whole picture of their spendings.
Analytics & Budgeting Intervals
Users preference for budgeting interval are diverse, some prefer to budget monthly, while others prefer daily or weekly. Analytics graphs should account for this factor and allow users to switch between weekly and monthly intervals.
From these insights, How Might We questions were generated to help guide design direction.
Exploration of ideas and concepts are guided toward addressing these key questions:
HMW provides users with better budgeting controls?
HMW provides users with more relevant analytics insights?
HMW make analytics across multiple currencies more accessible?
HMW accounts for different budgeting interval preferences?
Wireframes and sketches of potential solutions were explored at this stage, focusing on answering the previously generated HMW questions.